


As marketing becomes increasingly data-driven, businesses need to define and monitor relevant key performance indicators (KPIs).
Metrics measure activities or results; KPIs track progress towards a defined business objective and target.
The right KPIs show what is working, what needs attention and whether underperforming activity is consuming too much time or budget.
In this article, we explain important KPIs and supporting metrics for lead generation, revenue, SEO, PPC, website performance, email marketing and social media.
Contents
- How to choose the right marketing KPIs
- Core digital marketing KPIs
- Revenue-based marketing KPIs
- SEO KPIs and supporting metrics
- PPC advertising KPIs
- Lead-generation and sales-funnel KPIs
- Website engagement and conversion metrics
- Email marketing KPIs
- Social media KPIs
- How to turn KPI data into action
How to Choose the Right Marketing KPIs
Choose KPIs by connecting a business objective to a measurable target and reporting period.

Business objective → KPI → target → measurement period → data source → action
| Business objective | KPI | Target | Reporting period | Data source | Potential action |
|---|---|---|---|---|---|
| Generate more enquiries | Qualified leads | 20 per month | Monthly | GA4 and CRM | Improve underperforming landing pages |
| Increase paid advertising efficiency | Cost per acquisition | Below £60 | Monthly | Google Ads | Adjust targeting and advertising spend |
| Grow organic sales | Organic conversion value | Increase by 15% | Six months | GA4 | Expand successful SEO topics and landing pages |
A useful KPI should explain performance and support the next decision.
Our guide to creating a marketing strategy shows how objectives, audiences, channels and actions fit together.
KPIs Versus Supporting Metrics
A KPI is tied to a business objective and target; a supporting metric helps explain performance.
For a lead-generation campaign, qualified leads and cost per acquisition may be primary KPIs, while click-through rate, impressions and rankings help diagnose performance.
The same metric can serve different roles: organic traffic may be a KPI for search visibility but a supporting metric when the objective is sales.

Core Digital Marketing KPIs
Website Traffic
Website traffic provides useful context about marketing performance, particularly when it is segmented by channel, landing page, campaign and device.
Common traffic channels include organic search, paid search, social media, referrals, email and direct traffic. Device categories, such as mobile and desktop, should be analysed separately rather than treated as traffic sources.
Compare traffic with engagement, key events, leads, sales and revenue to assess the value generated by each channel.
Two of the most useful free measurement platforms are:
- Google Search Console, which shows how a website performs in Google Search, including clicks, impressions, click-through rate, average position, queries and landing pages. Google’s official Search Console Performance report documentation explains how these measurements are calculated and displayed.
- Google Analytics 4, which measures website and app activity after users arrive. It can be used to analyse acquisition channels, landing pages, engagement, key events and revenue. Google’s official GA4 Engagement overview documentation explains its engagement measurements.
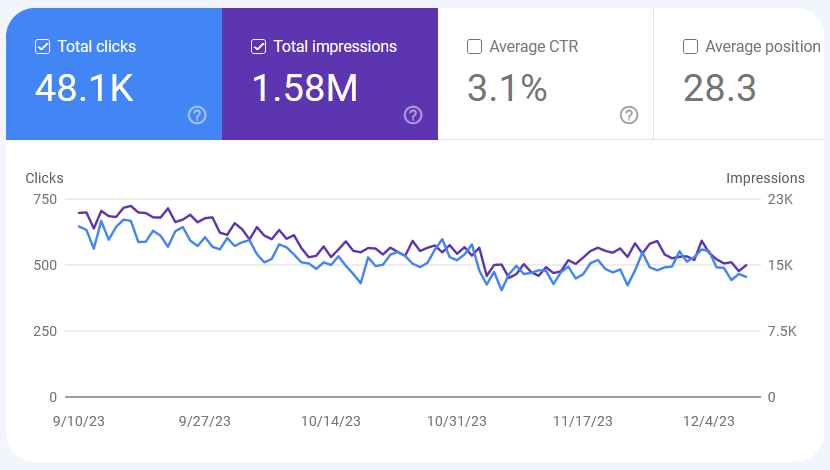
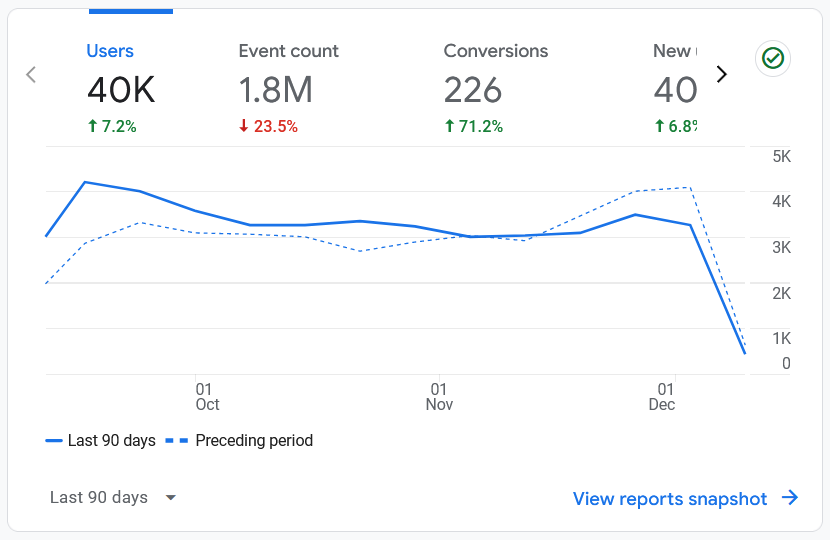
Our guide to web analytics provides a broader introduction to using analytics data to improve a website.
Configure analytics and advertising tools in line with privacy and consent requirements, and explain their use in the website’s cookie policy.
Qualified Leads
Leads are potential customers who have expressed an interest in a business by completing a defined action. This could include submitting an enquiry form, requesting a quotation, booking a consultation, subscribing to a newsletter or registering for a trial.
For enquiry-led businesses, assess lead volume alongside lead quality and conversion rate.
Two common lead lifecycle stages are:
- Marketing-qualified leads (MQLs): People who have demonstrated a meaningful level of interest or engagement but may not yet be ready for a sales conversation.
- Sales-qualified leads (SQLs): Leads that meet agreed qualification criteria and are considered ready for direct follow-up by the sales team.
Marketing and sales should agree MQL and SQL definitions based on the business, buying cycle and offer value. Documenting the funnel makes these stages and handovers easier to manage.
Revenue-Based Marketing KPIs
Cost per Acquisition
Cost per acquisition (CPA) measures the average campaign or advertising cost of generating a consistently defined outcome, such as a lead, sale or booking.
CPA = total campaign cost ÷ total attributed acquisitions
If the objective is to measure the full cost of gaining a new customer, customer acquisition cost (CAC) may be more appropriate:
CAC = total sales and marketing costs ÷ number of new customers acquired
CPA and CAC are not interchangeable. CPA normally assesses a specific campaign or conversion, while CAC can include wider sales and marketing expenditure.
Customer Lifetime Value
Customer lifetime value (CLV) estimates the financial value a customer generates throughout their relationship with a business.
A simple calculation is:
CLV = average purchase value × purchase frequency × average customer lifespan
Where reliable profitability data is available, gross margin should be included to produce a more meaningful estimate.
CLV can help a business compare one-time and repeat customers, plan retention activity and determine how much it can afford to spend on customer acquisition.
Marketing Return on Investment
Marketing return on investment (ROI) estimates the profitability of marketing activity.
Marketing ROI = (marketing-attributed gross profit − marketing cost) ÷ marketing cost × 100
Using gross profit rather than revenue provides a more realistic indication of the return generated by the investment.
Assess ROI alongside attribution quality, profit margin, customer lifetime value and scalability; the channel with the highest short-term ROI is not always the best place for additional budget.
Return on Advertising Spend
Return on advertising spend (ROAS) compares advertising-attributed revenue with advertising cost.
ROAS = advertising-attributed revenue ÷ advertising cost
For example, £5,000 in attributed revenue from £1,000 in advertising spend produces a ROAS of 5, sometimes expressed as 5:1 or 500%.
ROAS measures revenue efficiency rather than profitability. It does not automatically account for product costs, fulfilment, agency fees, discounts or returns.
Marketing-Attributed Revenue
Tracking marketing-attributed revenue helps stakeholders understand marketing’s contribution to business growth.
Attributed revenue = total value of sales or conversions assigned to marketing activity under the chosen attribution model
Attribution is an estimate rather than a perfect record of cause and effect. Reporting should therefore state which attribution model and lookback period were used.
Average Order Value and Repeat-Purchase Rate
Together, average order value and repeat-purchase rate show whether ecommerce growth comes from more customers, larger orders or stronger retention.
Average order value = total revenue ÷ number of orders
Repeat-purchase rate = customers who purchased more than once ÷ total customers × 100
SEO KPIs and Supporting Metrics
The objective of SEO is to improve visibility for relevant searches and attract visitors who are likely to complete valuable actions.
If you are new to search optimisation, The Beginner’s Guide to SEO explains how crawling, indexing, relevance and rankings work together.
Treat the following measurements as KPIs only when they are connected to a defined objective and target.
Organic Conversions and Conversion Value
Organic conversions are valuable actions completed by search visitors, such as purchases, enquiries, calls, bookings or registrations.
Organic conversion value or revenue usually provides a stronger connection to business performance than traffic or rankings alone.
Organic Clicks, Impressions and Click-Through Rate
Google Search Console can be used to monitor:
- Clicks: The number of clicks from Google Search results to the website.
- Impressions: The number of times a result from the website was displayed in Google Search.
- Click-through rate: Clicks divided by impressions.
- Average position: The average position of the highest result from the website for the selected report scope.
These metrics should be segmented by query, page, device, country and search appearance where relevant. A fall in site-wide average position, for example, may mean something different from a decline affecting one commercially important landing page.
Search Queries and Keyword Rankings
Search queries are the words and phrases people use when discovering a website through search engines. Monitoring rankings can show whether pages are gaining or losing visibility for searches that are relevant to the business.
A webpage can rank for many queries, so reporting should focus on meaningful themes and landing pages rather than a long, unprioritised list of keywords.
Direct organic query-to-conversion attribution is generally unavailable. Compare Search Console query and landing-page data with GA4 landing-page conversions to identify topics that may justify new products, services or content.
Inbound Links
Backlinks are generally a supporting SEO metric rather than a primary business KPI. Relevant, editorially earned links from credible websites can strengthen authority, generate referral traffic and support organic search visibility.
Assess links by relevance, editorial context, website credibility and referral potential—not volume alone.
For a wider view of the tools available, see our guide to SEO tracking tools. Technical issues can also affect every SEO measurement, so it is worth reviewing a technical SEO checklist when performance changes unexpectedly.
PPC Advertising KPIs
PPC measurement should connect advertising costs with meaningful outcomes such as qualified leads, sales, profit or customer acquisition. Our PPC guide for beginners explains how keywords, targeting, budgets and landing pages work together.
Click-Through Rate
Click-through rate (CTR) shows the percentage of advertisement impressions that generated a click.
CTR = clicks ÷ impressions × 100
CTR reflects how effectively an advertisement attracts attention, but only qualified traffic and conversions demonstrate commercial value.
Conversion Rate
Conversion rate measures the percentage of eligible advertising interactions that result in a defined conversion.
Conversion rate = conversions ÷ eligible advertising interactions × 100
Cost per Click, Cost per Acquisition and ROAS
Cost per click (CPC) shows the average amount paid for each click:
Average CPC = total click cost ÷ total clicks
CPC is a supporting efficiency metric. CPA and ROAS usually provide a clearer view of whether those clicks are producing commercially valuable outcomes.
Quality Score
Quality Score is a diagnostic Google Ads metric comparing the relevance and usefulness of a keyword, advertisement and landing page with other advertisers. Google confirms that it is neither a KPI nor an auction input. Source
Quality Score is based on three reported components:
- Expected click-through rate
- Ad relevance
- Landing-page experience
Use these components to diagnose keyword, advertisement and landing-page issues—not as targets themselves.
Ad Rank and Search Visibility
Ad Rank is a set of values Google uses to determine whether an advertisement is eligible to appear and, if eligible, where it appears relative to other advertisements.
Top impression rate shows the percentage of advertisement impressions that appeared above the organic search results. Absolute top impression rate shows the percentage that appeared as the first advertisement above the organic results.
Use these metrics to diagnose reach and competitiveness, not as substitutes for conversion or financial KPIs.
Lead-Generation and Sales-Funnel KPIs
Lead-generation KPIs show how prospects progress from enquiry to sale; define and record each stage consistently in your CRM.
Website Lead-to-MQL Rate
This measures the percentage of website-generated leads that meet the agreed marketing-qualified lead criteria.
Website lead-to-MQL rate = marketing-qualified website leads ÷ total website leads × 100

Segmenting this rate by channel, campaign and landing page can reveal which sources generate stronger prospects rather than simply more form submissions.
MQL-to-SQL Rate
The MQL-to-SQL rate shows the percentage of marketing-qualified leads that progress to the sales-qualified stage.
MQL-to-SQL rate = sales-qualified leads ÷ marketing-qualified leads × 100
This can help identify potential gaps in lead qualification, nurturing or the handover between marketing and sales.
SQL-to-Quote Rate
The SQL-to-quote rate shows the percentage of sales-qualified leads that progress to the quotation or proposal stage.
SQL-to-quote rate = quotations issued ÷ sales-qualified leads × 100
Lead-to-Customer Rate
The lead-to-customer rate measures the percentage of leads that ultimately become customers.
Lead-to-customer rate = new customers ÷ total leads × 100
Interpret it in the context of lead definitions, sales-cycle length and average customer value.
Website Engagement and Conversion Metrics
Average Engagement Time
Longer engagement is not always better. A visitor who quickly finds a phone number and calls may be more valuable than someone who browses without taking action.
Bounce Rate and Engagement Rate
In GA4, an engaged session is one that lasts longer than 10 seconds, records a key event or includes at least two page or screen views. Engagement rate is the percentage of sessions classified as engaged. Bounce rate is the percentage that were not engaged.
Google’s official GA4 engagement rate and bounce rate documentation provides the complete definitions.
A high bounce rate does not automatically indicate poor content; visitors may find the answer they need and leave. Interpret it according to the page’s purpose and conversion performance.
Website Conversion Rate
Website conversion rate measures the percentage of website sessions or users that complete a defined action. Choose the denominator that best suits the objective and use it consistently.
Session conversion rate = sessions with a conversion ÷ total sessions × 100
A conversion can be a purchase, enquiry, call, booking, registration or another action that contributes to the business objective.
If conversion performance needs improvement, our introduction to conversion rate optimisation covers the relationship between audience needs, page experience and calls to action.
Email Marketing KPIs
Email KPIs should measure whether campaigns reach the right people, generate meaningful engagement and contribute to conversions or revenue.
Delivery Rate
Delivery rate shows the percentage of sent emails accepted by recipients’ mail servers.
Delivery rate = delivered emails ÷ emails sent × 100
Delivery does not guarantee inbox placement; a falling rate may indicate list-quality or sender-reputation problems.
Click-Through Rate
Email click-through rate measures the percentage of delivered emails generating at least one click, subject to the platform’s reporting definition.
Email CTR = unique recipients who clicked ÷ delivered emails × 100
Conversion Rate and Revenue per Recipient
Email conversion rate shows how many recipients completed the intended action after interacting with the campaign. Revenue per recipient can help ecommerce businesses compare the commercial performance of campaigns sent to audiences of different sizes.
Revenue per recipient = attributed email revenue ÷ delivered emails
Unsubscribe Rate
Unsubscribe rate can help identify whether campaign frequency, targeting or content is failing to meet subscriber expectations.
Unsubscribe rate = unsubscribes ÷ delivered emails × 100
Open rate provides context, but privacy features and automated image loading make it unreliable as a primary measure of success.
Social Media KPIs
Engagement and Engagement Rate
Social media engagement includes interactions such as reactions, comments, shares, saves and link clicks. The precise definition varies between platforms.
Total engagement can show the scale of response, while engagement rate allows posts with different levels of reach or audience size to be compared more fairly.
Engagement rate by reach = total engagements ÷ reach × 100
Always record the formula used, because platforms and reporting tools may calculate engagement rate differently.
Reach and Impressions
Reach and impressions are supporting visibility metrics. Impressions count the total number of times content is displayed, while reach estimates the number of unique accounts shown the content.
High reach alone does not demonstrate business impact; interpret it alongside engagement, website traffic and conversions.
Social Media Traffic and Conversions
Referral data in GA4 can show how much website traffic arrived from social networks and what those visitors did after arriving.
With reliable tracking and consistent campaign naming, compare social activity using engaged sessions, key events, leads, revenue and conversion rate.
How to Turn KPI Data Into Action
A KPI report is valuable only when it supports a decision. For every primary KPI, record:
- The business objective
- The exact KPI definition and formula
- The target
- The reporting period
- The data source
- The person responsible for reviewing it
- The action to take when performance is above or below target
A concise report might contain three layers:
- Outcome: Did the primary KPI meet its target?
- Diagnosis: Which supporting metrics help explain the result?
- Action: What will be maintained, tested, reduced or changed?
A smaller set of clearly defined KPIs produces better decisions than a dashboard filled with measurements that have no agreed purpose.
Conclusion
Effective measurement starts with a business objective, KPI, target and reporting period; supporting metrics help explain changes in performance.
Review KPIs regularly and turn significant changes into decisions about targeting, content, landing pages and budget allocation.
If you need help selecting the right KPIs, configuring measurement or turning your reports into an actionable marketing plan, contact SEO Impact.
