
Let’s get one thing straight: stalking, in most cases, is a problem. Stalking your ex’s photos on Facebook? Definitely frowned upon. Stalking in real life? 100% illegal.
But stalking your own website statistics? Well, that’s just good business sense. I’m talking about web analytics, which gives you all the juicy details on how users are interacting with your site.
The data gathered using web analytics can be used to help you improve user experience and ultimately make your business more successful.
Web Analytics Explained and Expanded
Web analytics is a way of collecting, analysing, and reporting web data. It involves gathering information about website visitors and how they interact with the site.
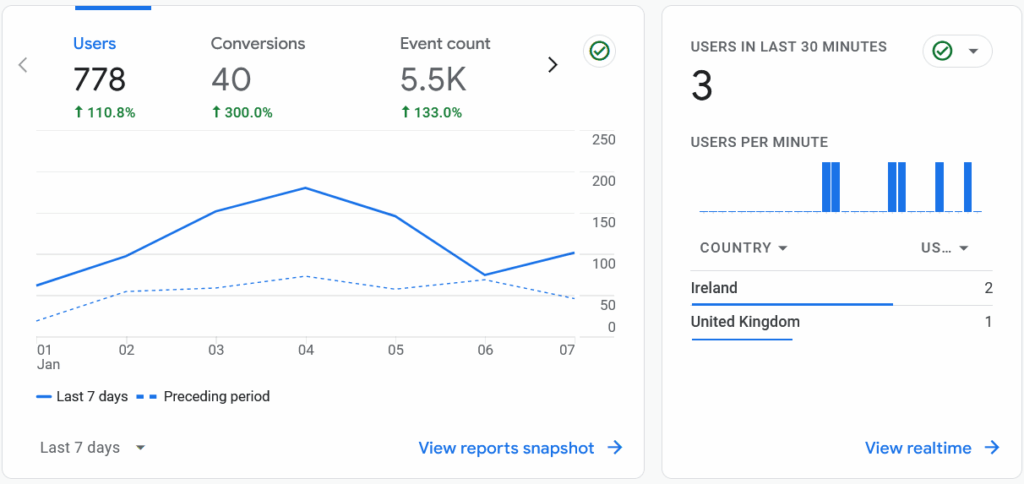
The point of using web analytics, such as Google Analytics 4, is to allow website owners to make data-driven decisions to improve user experience, content, and online strategies.
It can be used by anyone, whether an SME, large enterprises, personal use and more, to track any sort of site, blogs, static websites, eCommerce websites etc.
It gives you an opportunity for a complete analysis of website performance and user behaviour. Leveraging this data will allow you to better target your audience and to improve and optimise your website for the ultimate user experience.
Google Analytics 4 can be used in combination with other Google SEO tools like Google Search Console and Google Tag Manager which makes it even more useful for improving the SEO of your website and taking your digital marketing to the next level.
Typical data that web analytics reports on include:
Pageviews
Pageviews refer to the total number of times a particular page on a website has been viewed or loaded by users.
Every time a user accesses and loads a webpage, it counts as one pageview.
Pageviews are a fundamental metric in web analytics and are used to gauge the popularity of a website or specific pages within it, however, this data should be viewed in conjunction with other data. Since pageviews do not take into account unique views, a small number of people reloading one page on your website could incorrectly give the appearance that the page is very popular.
Views and Users
For example, if a user visits a website’s pricing page, then moves onto the location page, and heads back to the pricing page, this will only count as one unique pageview for the pricing page, this may count as multiple views, but it would still relate to the same user within that visit.
Unlike total pageviews, which count every instance of a page being loaded, looking at users alongside views gives you a more balanced understanding of user interest.
Unique Users
Unique users represent the number of individuals who visit a website within a specified time.
This metric is essential in web analytics as it helps measure the size of a website’s audience by counting each user only once, regardless of how many times they visit the site during the timeframe.
Analysing unique users can provide insights into the total number of individuals who have engaged with a website to help determine overall popularity, however, they may not always be precisely accurate.
For example, one person may view a website on their personal computer, and then visit the same website on their mobile. This will count as two unique users because of the way web analytics track users.
Returning Users
Returning users are individuals who have visited a website at least once before and return for additional visits.
This is a key metric to observe in web analytics because it allows you to understand user behavior and measure user loyalty. You can also track returning users over a specified time period to assess the effectiveness of your efforts to retain your target audience.
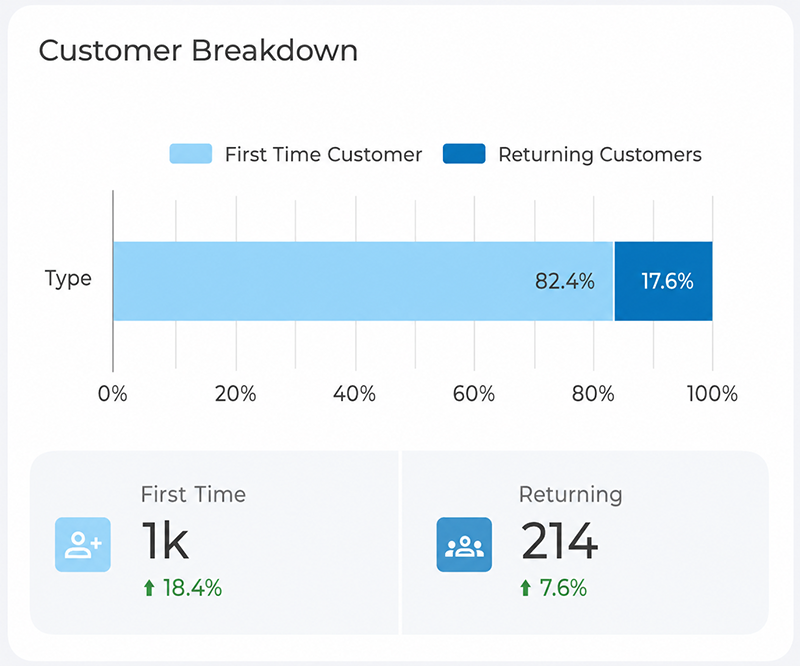
In practice, this often looks like a simple breakdown of first-time versus returning visitors. In the example above, returning customers make up just under 18% of total users – but if that segment is growing faster than new customer numbers, it can signal strong retention even while new customer acquisition slows.
Bounce Rate
Bounce rate is commonly used to measure the effectiveness of a website’s landing pages, which can encourage a website owner to reassess the page content, the page loading time, or potential navigation issues.
If you’re experiencing high bounce rates this could indicate that the content on a landing page is not engaging or relevant to the visitor’s needs, and therefore they leave without exploring further.
It could also be a sign of poor site navigation or confusing layouts, which discouraged the users from exploring further.
Slow-loading pages can also be a significant factor for high bounce rates, as users may become impatient and exit the site.
Traffic Source
A traffic source refers to the route users took to arrive at a website, for example, did they organically arrive at your site using Google, or did they click a paid advertising link?
Measuring the traffic source provides insights into how visitors find a website, which in turn tells us how effective marketing efforts have been, and how to optimise future online strategies.
Different sources include:
- Organic – This traffic comes from Google or another search engine when someone uses keywords in a search query that you have used in your SEO.
- Direct – When someone manually types in the URL of your site in the browser.
- Referral – This traffic comes from other sites on which your website was mentioned. For example, a blog posted a link to your website in their blog post content, and a visitor clicked on that link.
- Email – The traffic that is generated through email marketing.
- Social – A visitor that is redirected from a social media platform like Facebook or Twitter.
- Paid Search – A visitor that clicks on a paid ad that is linked to your site.
- Display – When someone visits from a display ad.
- Affiliate – A visitor that is generated through affiliate marketing.
- Other – When Google Analytics doesn’t know from where the traffic is generated, it is categorized under ‘Other’.
Metrics and Dimensions
Before looking at Google Analytics reports, we will discuss metrics and dimensions. The reports you’ll get will be based on metrics and dimensions – so listen up!
- Metrics – Just like any other metric. These are quantitative ways of measuring data. You can calculate and track your metrics. For example, sessions, age and population.
- Dimensions – These are ways of grouping data with certain attributes into categories. For example, cities, names, country, browser.
Here are few more examples.
Example Dimensions:
- Browser
- Exit pages
- Location
- Country
- Device
Example Metrics:
- Users
- Number of Sessions
- Number of Page Views
- Bounce Rate
- Number of Key Events
In Google Analytics reports, dimensions are the rows and metrics are the columns. You can also create custom reports that combine different dimensions and metrics.
You can combine different dimensions and metrics to produce a report that is valid for your business goals.
However, not all dimensions and metrics can be combined into reports.
Each dimension and metric has a scope, which is the level at which data is collected. The different scopes include user-level, session-level and hit-level. Only dimensions and metrics that operate on the same scope can be combined together.
How Can Web Analytics Benefit You?
Web analytics might sound challenging, but the insights gained can be essential in making informed decisions about everything from website design and content strategy to marketing campaigns and overall online performance.
Web analytics encompasses a huge range of different types of data you could analyse to gain insights into your website and your audience.
However, not every component of web analytics will be relevant to your business, and measuring every piece of data available can be overwhelming.
Instead, you could opt to focus on one particular area, for example, user retention. Here, let’s explore the areas in which web analytics could be used to benefit your business.
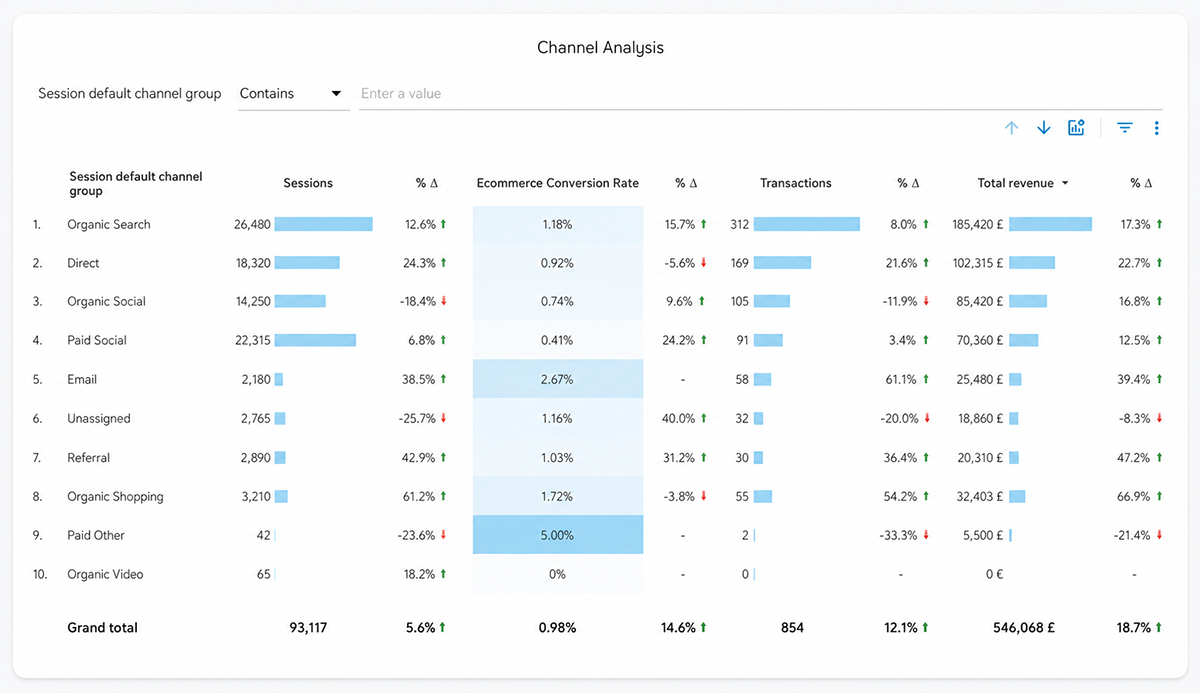
Traffic source data isn’t just about volume – it’s about value. Looking at the Channel Analysis report below, Organic Search brings in the most sessions, but Email – despite far lower traffic – has the highest conversion rate. This is the kind of insight that should shape where you invest marketing budget and effort.
Determine Demographics
You can find out things about users of your website using analytics tools, for example where they are located, their age, their gender, and the type of device they are using.
This information can help you better understand your audience, and allow you to create targeted marketing plans.
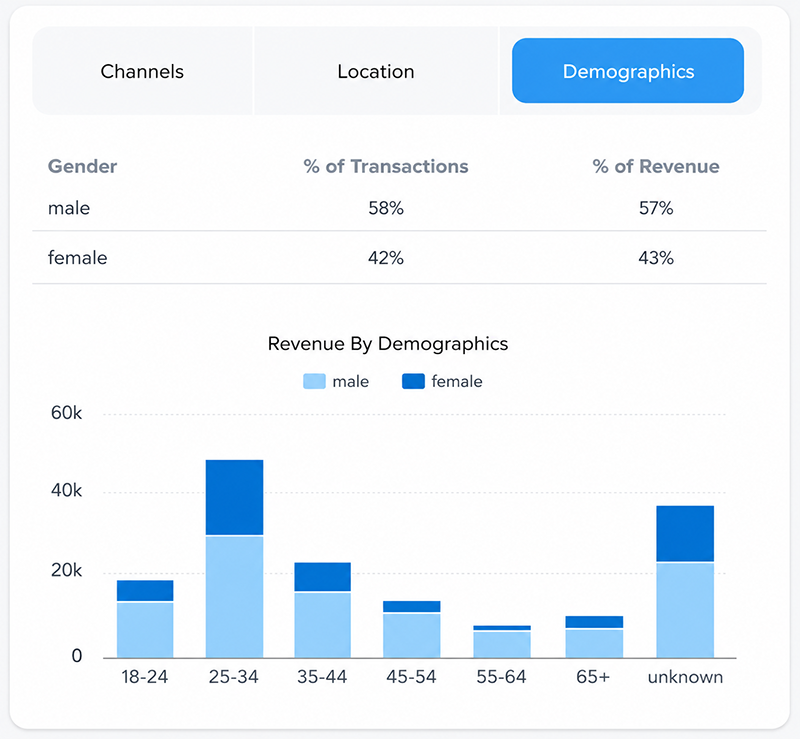
In practice, this might look like a revenue breakdown by age and gender. In the example below, male users account for 63% of transactions and 59% of revenue, while the 25–34 age group drives the highest revenue overall. Insights like this can directly shape who you target in future campaigns – and where that targeting might currently be missing the mark.
Traffic Tells
Knowing how your audience reached your website is very powerful information.
If a low proportion of visitors come to your website through paid advertising, you know you can quit pursuing that particular avenue.
If you aren’t getting as much traffic through search engines as you’d hoped, maybe you need to up your SEO game.
Consider Content
By tracking the performance of specific pages, you can determine what type of content was popular among your visitors, as well as what wasn’t.
This can lead to better content planning in the future, to meet the demands of your audience.
Marketing Metrics
You can use it to measure the effectiveness of marketing campaigns, for example, look at click-through rates and conversions.
This data is valuable in helping optimise future marketing strategies, and ensuring marketing expenditure isn’t wasted.
Find Your Top Converting Pages and Improve Them
Generating traffic is not always the main priority. Conversion Rate Optimisation is equally if not more important than traffic building.
All the visitors in the world will mean nothing if you can’t convert them.
Using Google Analytics, you can see which pages of your site are generating the most traffic and the most key events or conversions. These are spots that clearly generate a lot of interest, what are you doing right here?
- Have you used conversion rate optimisation?
- Do you have particularly enticing ad copy?
- Did this page gain a very significant back link that is sending traffic your way?
Find out what is going right and see if you can recreate it on other pages. Are there ways to optimise these high performing pages and turn them into sales drivers?
To find the highest converting pages you can access the analytics of landing pages by going to:
Reports > Engagement > Landing page, then sort the table by Key events.
Find Pages That Needs Little Tweaks to Uplift
In some cases, there are a few pages that are doing well but with a little tweak here and there can result in lower bounce rates, higher conversion, and more traffic.
If you are using SEO to rank your pages, you need to follow SEO best practices to rank your pages in the top search results.
Find and Fixing Pages the Users Aren’t Engaging With
GA4 can highlight what pages your users are not engaging with.
If a page is not performing well, you can always change your SEO or marketing strategies according to the analytics gathered and track the effects of your changes. Use insight from other pages to see what your users interact with most and apply it to your other pages.
Use A/B testing to track your adaptations as you go!
Improve User Experience
Low engagement, high bounce rates, and drop-offs partway through a page often point to a UX problem rather than a content or traffic problem. Metrics like average engagement time and scroll depth can reveal whether visitors are struggling to navigate your site, find key information, or complete an action.
If analytics consistently point to users leaving before converting, it may be time to look beyond the numbers and assess the design itself. Our guide to UX/UI design in digital marketing covers how design choices directly affect these kinds of engagement metrics.
Conclusion
The Devil is in the data!
Knowing how to interpret web analytics and using this information as a means of bringing about change on your site is absolutely essential for anyone who runs a website today.
After all, how can you expect to know how to improve if you don’t know what is and isn’t working?
Think of it as a school report detailing the areas where you need to work harder, only instead of getting your report at the end of term, you can access an updated report at any time, on any given day.
A marketing strategy that is based on solid market research and accurate data, has a much higher chance of success than one based on intuition. No matter what size organisation you operate, make sure that you are making data-driven decisions.
If you don’t track your user data and use it to improve your online asset, you can quickly be out performed by the competition and lose market share.
Google Analytics is one of the most widely used tools for analyzing website data. It’s a must have for the business growth and it is free to use for small and medium sized businesses. So you give it a try!
Need help with your web analytics? Contact us today.